Intrinsic time: A new theory of economics

- Date
- 30/11/2022
- Written by
- Lykke
- Share
- Leave your opinion (0 reviews)
The disappointing performances of existing economic models are largely due to their reliance on physical calendar time, making them static and rigid. Ultimately, this means that they fail to respond to the disruptive events that characterize markets and the economy at large with sufficient rapidity. Accordingly, this article introduces a new timescale, called ‘intrinsic time’, that better reflects the temporal nature of the market and, most importantly, can provide predictive information. Intrinsic time is the starting point for a new theory of economics.
At Olsen & Associates, the first company I founded back in 1985, we developed an online service with state-of-the-art economic models and tick-by-tick market data to provide a real-time predictive information service for decision makers such as hedge-fund managers, traders, and treasurers at banks and corporations. We documented this model technology in the book ‘Introduction to High Frequency Finance’ by M. Dacorogna, R. Gençay, U. Müller, R. Olsen and O. Pictet published by Academic Press in 2001, and it soon became a standard reference manual for quantitative hedge-fund management. However, even though our technology was best-in-class, its actual performance was poor, barely surpassing that of a standard Excel spreadsheet model supplied with daily rather than dynamic data. This was a disappointing outcome considering all our efforts and the fact that we were using a wealth of tick-by-tick data (up to 100,000 ticks per instrument per day). So, why were our models barely better than a simple model supplied with daily data?
Classical economics: Mission impossible
Classical economics offers an explanation for the disappointing performances of economic models applied to financial markets: If economic models were successful and investors were able to extract excess returns, profit-seeking investors would arbitrage the information inefficiency and thus undermine the effectiveness of the models. This supposedly explains why it is impossible to build models that have persistent superior performance.
However, this argument did not ring true for us in view of the many unexpected statistical properties we had discovered researching huge amounts of data. In separate articles, I will explain the discoveries we made in more detail and why this gave us confidence that we could crack the problem.
Price overshooting as a profit opportunity
One statistical property stands out and still amazes me every day: on a microscale, prices move up and down with a lot of overshooting with prices moving too far and then revert. The price overshoots measured in percentages can be added up. For example, if this is done for EUR/USD; the sum of price overshoots during the course of 24 hours has an average length of 6% and 1600% for a year as a whole. This compares with an absolute price change from midnight to the following midnight of only 0.3% and for the year as a whole of 10%–20%. In other words, there is price overshooting of approximately 5.7% per day and 1570% per year.
A trader with perfect foresight who takes advantage of every small price movement can earn 6% per day and a whopping 1600% per year after paying for transaction costs. Obviously, perfect foresight does not exist, but why do professional asset managers, quantitative funds, etc., find it so difficult to earn at least 1%, 2%, 3%, or 10% per year if there are so many overshoots when the price departs from its trend? Why do the algorithms of traditional models fail to take advantage of the overshoots to earn extra profit? What is wrong? This should not be difficult, because an algorithm has full freedom - a bot does not have to have a continuous position; it can pick and choose and only enter the market when the probabilities are stacked in its favor. In cases where the bot has, nevertheless, opened its position at the wrong moment in time, the algorithm can manage the position to benefit from the recurring price overshoots. Why do the algorithms fail? Starting in 2001, we began several years of meticulous study to investigate what was wrong. The answer was surprisingly simple.
The rigidity of physical calendar time
The existing models fail because they were all formulated in terms of physical calendar time, where data is sampled at intervals on a monthly, daily, or hourly basis. The fixed calendar is not in sync with the time that market extremes occur; it is a rigid grid that mirrors the pace of the earth’s speed of rotation and does account for the actual dynamics of what is happening in the market.
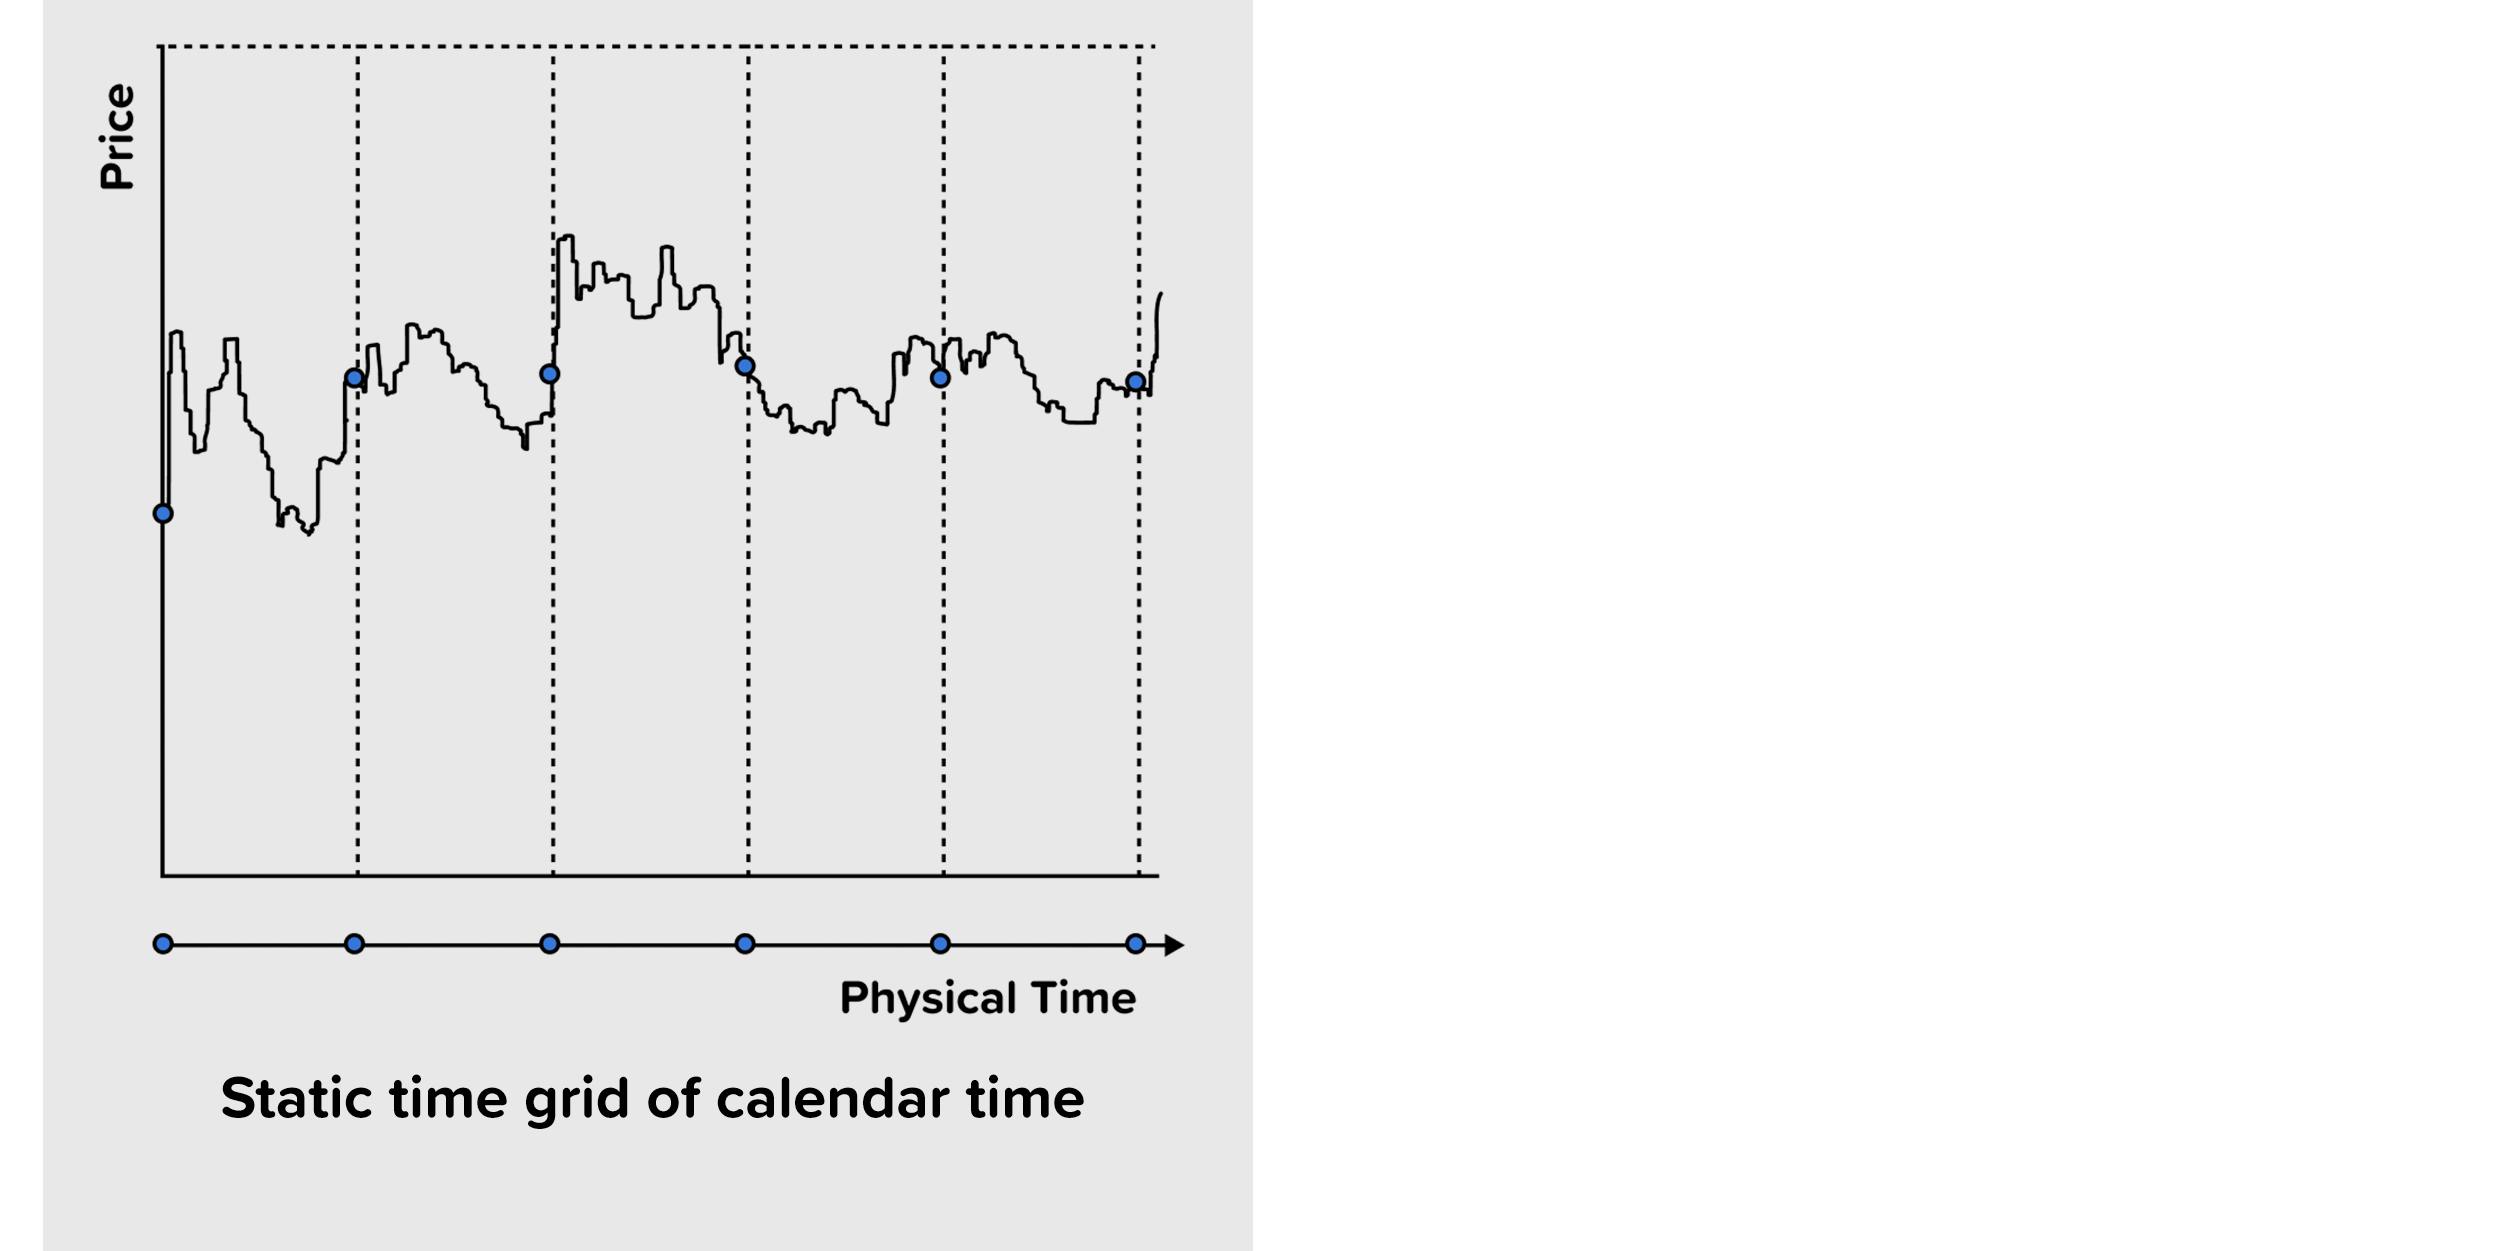
Calendar time is static and therefore prevents models from correctly differentiating between super active periods when prices are kicked around and quiet periods when nothing is happening. Action in financial markets is triggered by a multitude of unexpected events, where a news story breaks and ‘all hell breaks loose’, so if models have to wait until a certain amount of calendar time has elapsed for data to be included in the algorithm, the model response is too late and losses are incurred.
Definition of intrinsic time
Having realized that calendar time was not working, we had to find a more appropriate timescale. We needed to come up with a definition of time that was dynamic and would immediately respond to price shocks whenever they occur.
I will report how we formulated the proposal and what influenced our thinking in more detail later.
Briefly, we decided on a radical approach, i.e., to forget about physical time altogether and slice the data by events. We defined the event operator as follows: an event is a price reversal bigger than x% from a previous high or low. Analogously to the concept of seconds, minutes, and hours, etc. We can specify intrinsic time in terms of small, medium, and large events; for example, price reversals of 0.1%, 1%, 2%, or whatever is appropriate.
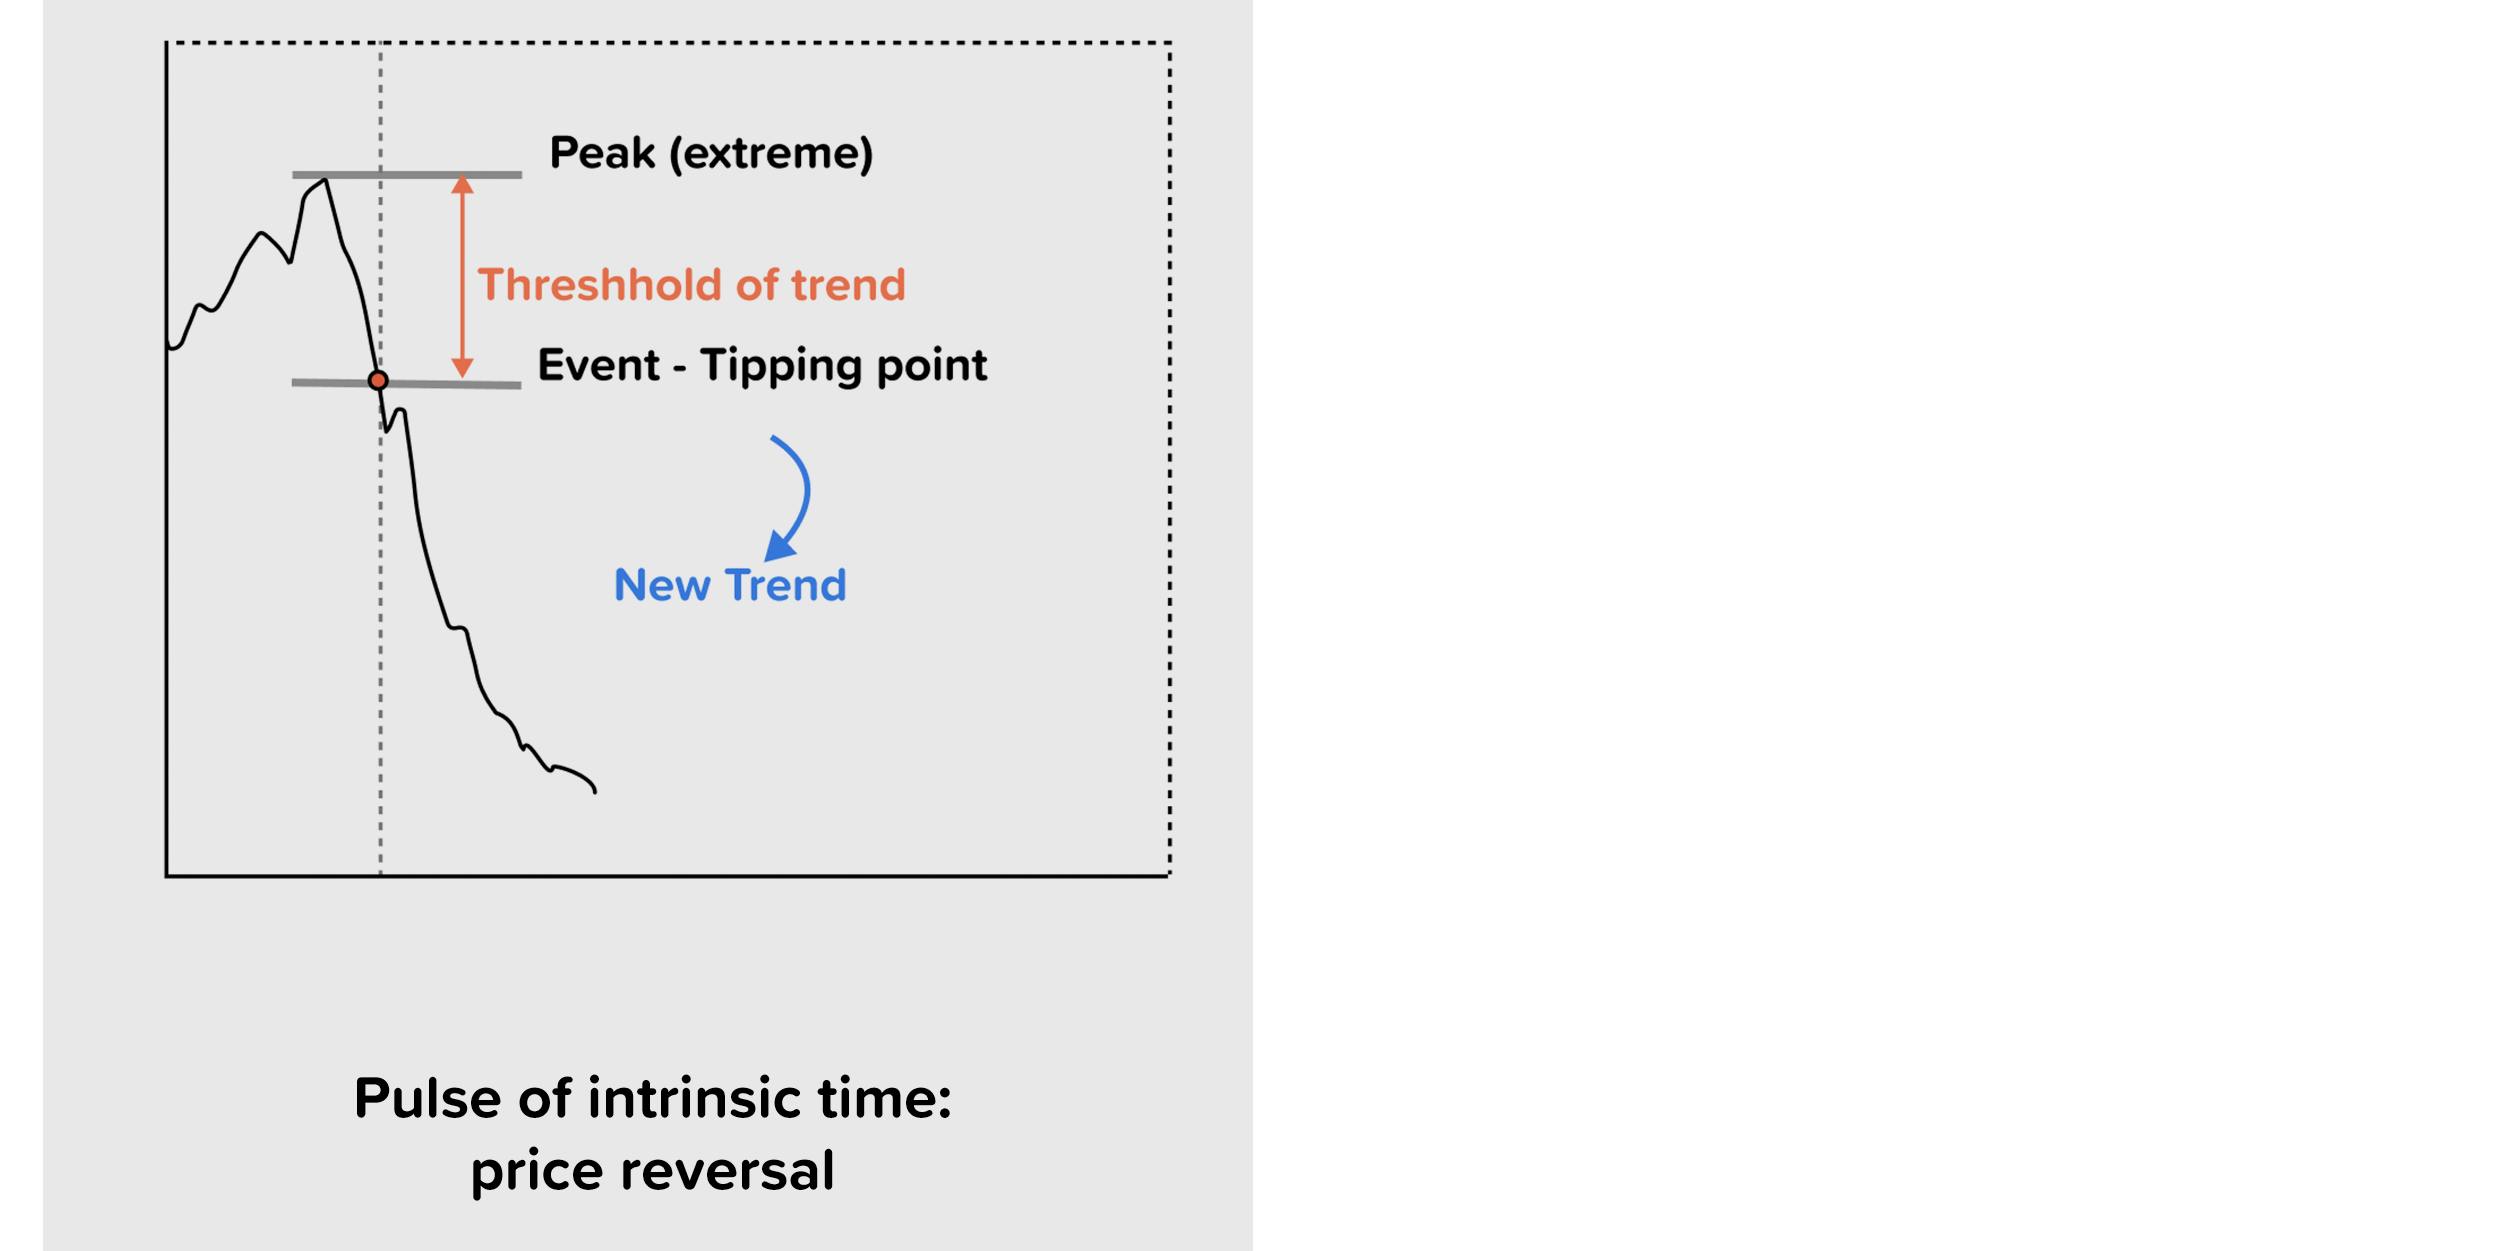
The 1% intrinsic clock ticks whenever a 1% price reversal happens. If the price drops from a recent high of 100 to 99, then the 1% clock has ticked. The intrinsic clock ticks again as soon as the price rises by 1% from its most recent low. So, if the price drops from 99 to 97 and then rises to 97.97; the intrinsic time (1%) ticks again. The intrinsic time clock mechanics is simple: the 1% intrinsic clock ticks only when a price reversal of 1% occurs.
Intrinsic time is dynamic, so when markets are quiet or closed such as over weekends, the intrinsic clock stands still. At other times, when markets are in full swing, prices move up and down and important news occurs, so the intrinsic clock ticks at a rapid pace. The threshold of the event clock, be it 1%, 2%, 3%, or whatever other threshold, determines the rate at which the intrinsic clock ticks.
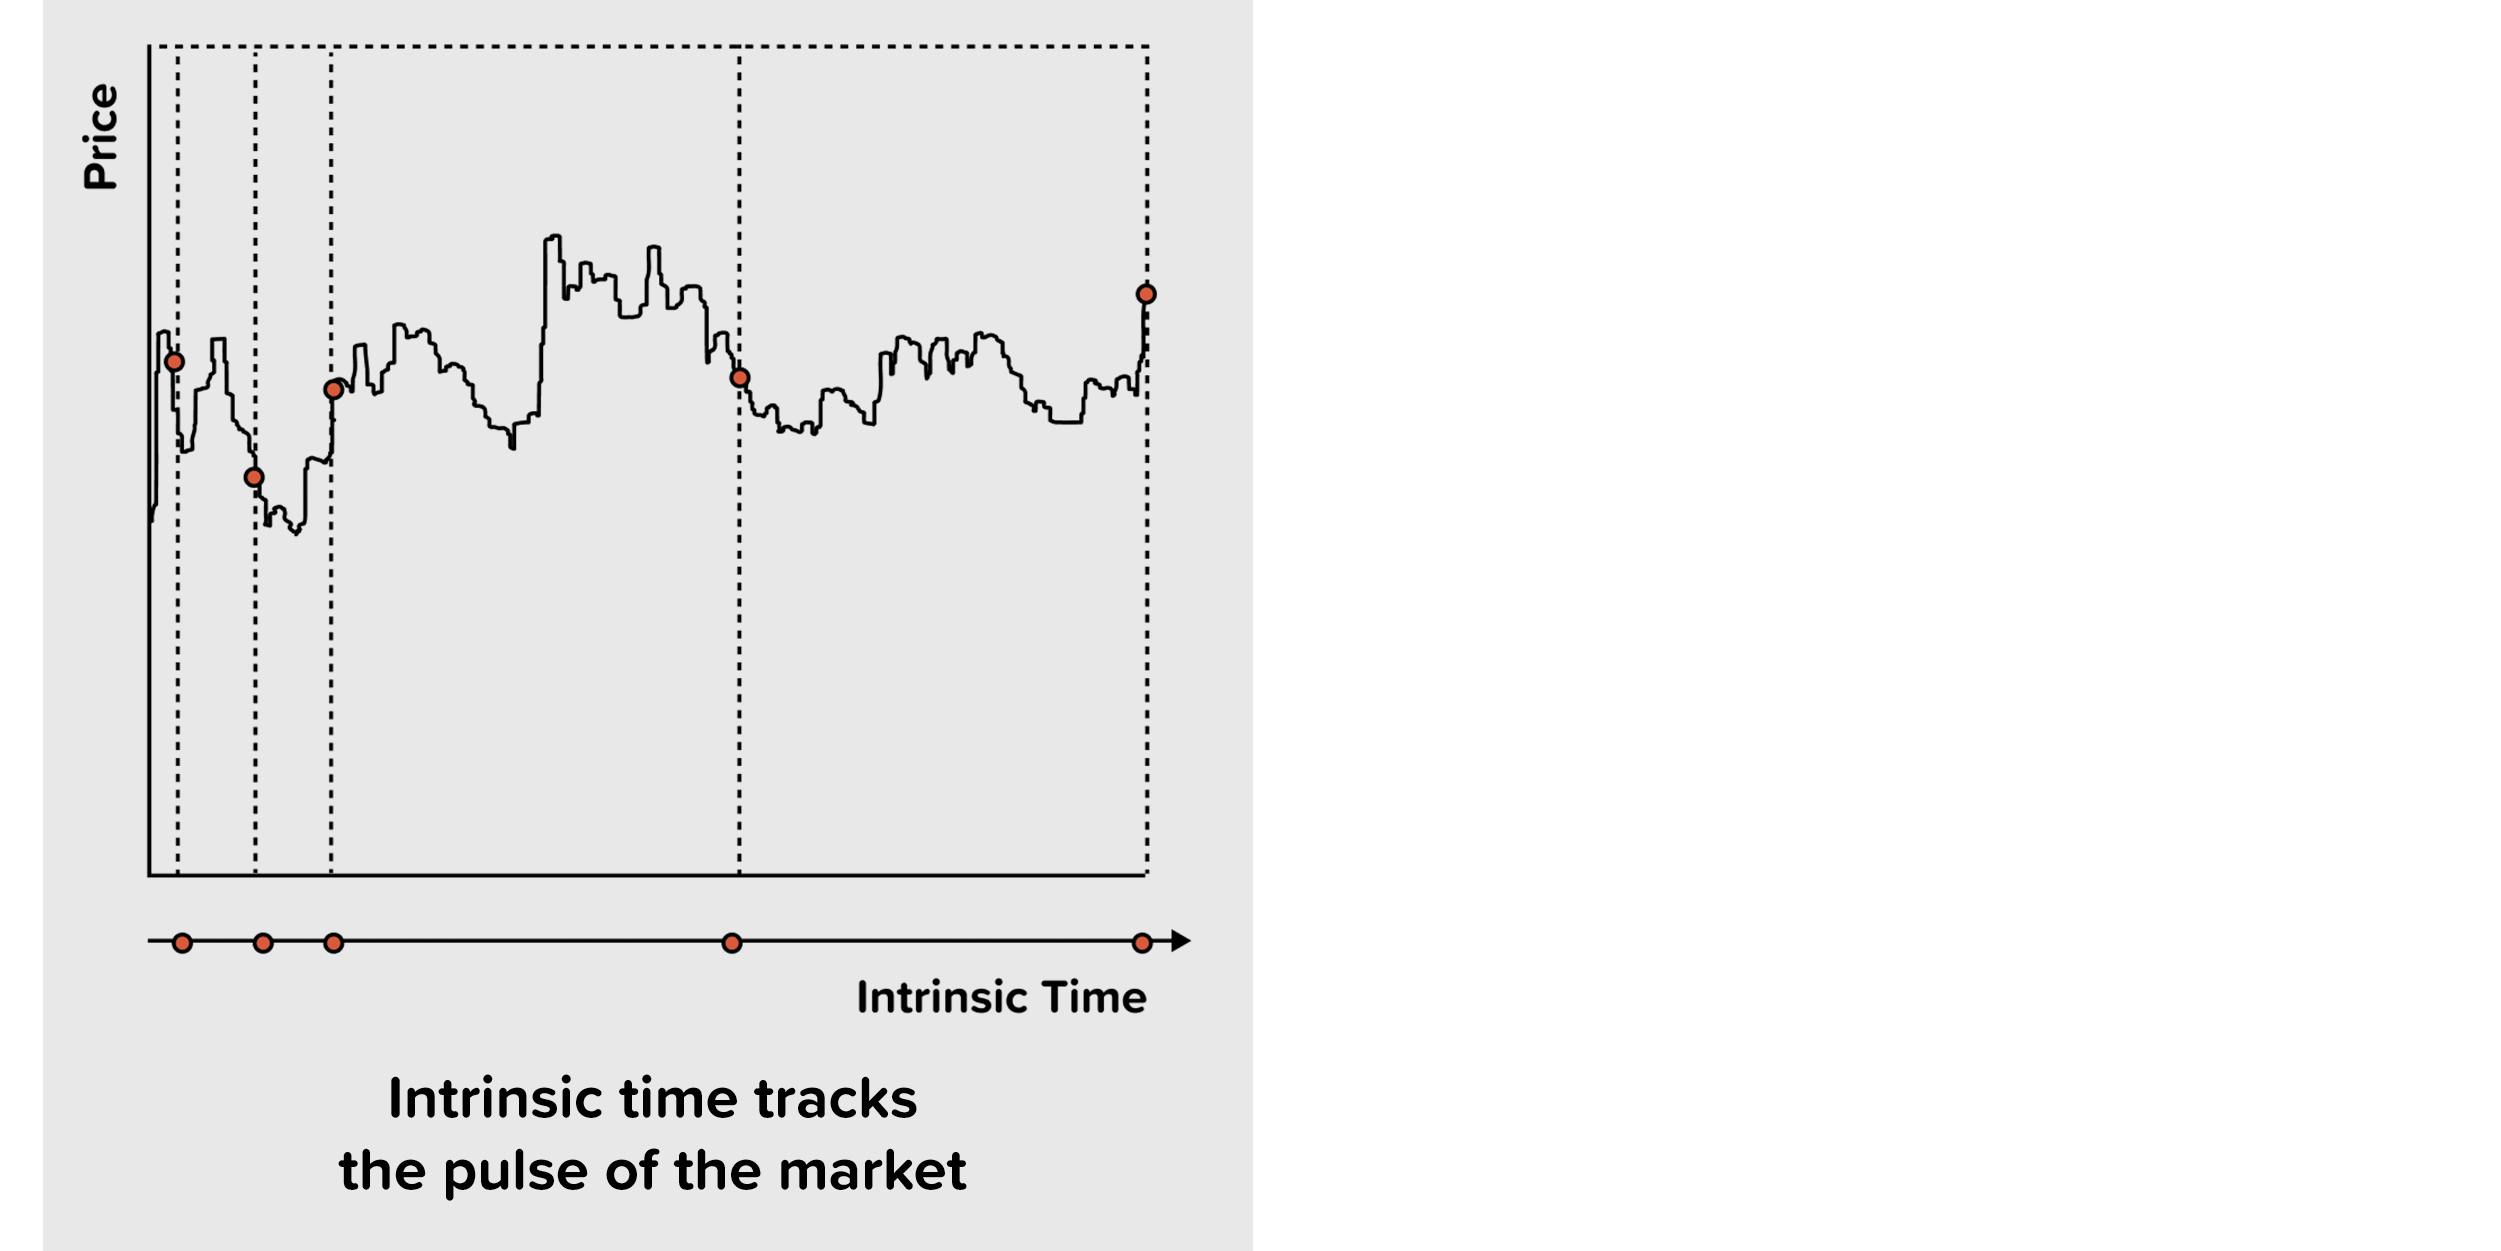
The term ‘intrinsic time’ highlights its key difference to physical time; the new timescale ticks with the beat of the events of the data series itself. The ups and downs of market prices determine the flow of intrinsic time, so its passage is not dictated by the rate of Earth’s rotation, as is true for calendar time.
The benefit of intrinsic time is that data sampling happens when there is ‘action’ in the market. If the market is closed, then the model automatically accelerates the passage of time. For instance, in intrinsic time, the weekend is compressed and passes in a flash. The most profound benefit of intrinsic time is that the model automatically kicks in when markets are moving and things are happening. Thus, it automatically focuses on what is relevant for achieving good performance.
Discovery of trending behavior
There is a further benefit of intrinsic time that is surprising and not intuitive at a first glance.
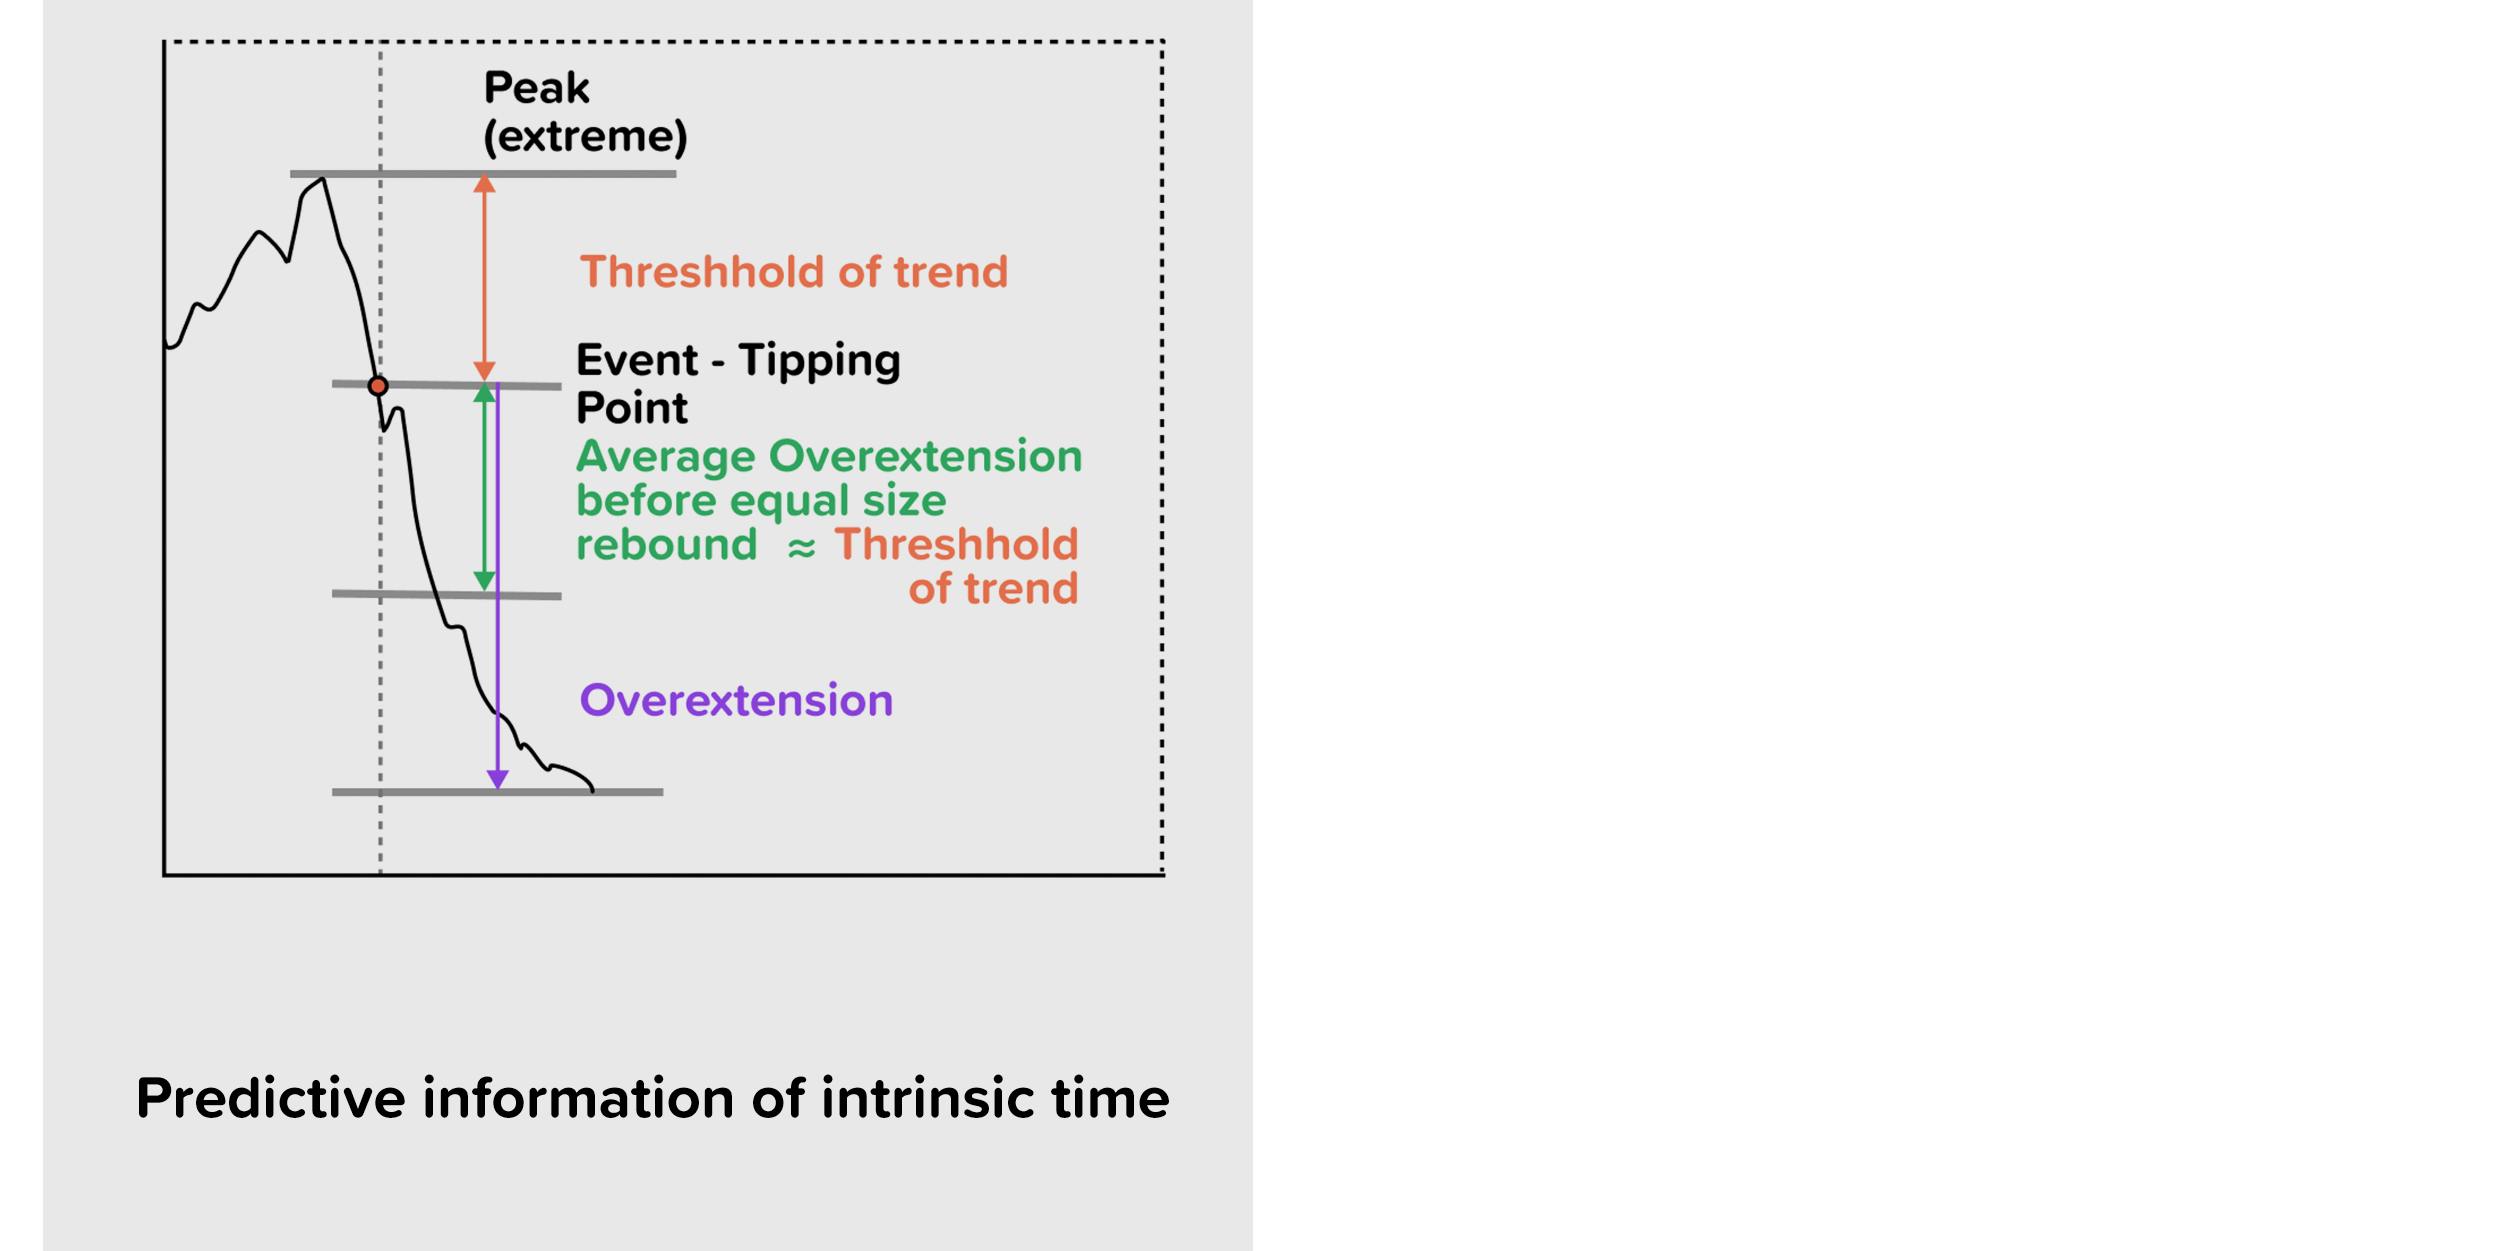
Let us assume that we have just recorded a price drop of 1% from the recent peak of 100 and are now at 99. What can we expect from here onwards? How much further will the price most likely drop before it moves back up again by 1%? Any trader would ask these questions. This information would help them to calibrate their trading, manage their positions better, reduce losses, and earn a profit.
The surprising answer is that the price will on average continue to drop by another 1% before it moves back up by 1%.
This is true for any financial market, be it equity, commodity, or cryptocurrency. This empirical evidence has been documented in a number of publications, most notably Patterns in high-frequency FX data: Discovery of 12 empirical scaling laws, January 2008, Quantitative Finance 11(0809.1040) by J. Glattfelder, A. Dupuis, and R. Olsen, in which we first reported the result.
Development of the alpha engine
The knowledge that the price will on average continue to drop by another 1% before reverting by 1% is valuable information for any trader, portfolio manager, or treasurer. Based on this knowledge, it is not advisable to bet on an immediate price reversal when the price has just dropped to 99 and the 1% intrinsic clock has just ticked. The decision maker has to take into account that the price will on average continue to drop by another 1% before it reverts; so it is not advisable to bet on an immediate rebound. They have to scale their position in such a way as to take into account the probability profile of the subsequent price. At times, the price may not revert at 99 or even at 98 and continue to drop. However, as long as there is no price reversal of 1%, the initial 1% clock that ticked at 99 is increasingly overextended, making a rebound of 1% increasingly likely. This information is valuable information in the overall decision making of when to open a position, how big the position should be, and also when to take a profit or consider reducing a position to manage risk.
There is a long way between having a good predictive indicator and having a fully automated trading bot that can take trading decisions without external intervention. Developers of self-driving cars know about the challenges involved. The paper The Alpha Engine: Designing an Automated Trading Algorithm by Anton Golub, James B. Glattfelder, and Richard B. Olsen, which is published in the book High-performance Computing in Finance, 1st Edition, 2017, Chapman and Hall/CRC, describes how it is possible to build successful trading bots.
Conclusions
The concept of intrinsic time presents new possibilities for predictive modeling. The scientific papers that we have provide detailed information on backtesting results and the performance of the indicator. We use the intrinsic time indicator as the underlying methodology for ‘Attmo’ and to define different weather states.
In the following contributions I will explain in the language of popular science why intrinsic time is not just a technical indicator such as moving averages or oscillators, which we are all very familiar with; why the methodology is so radical; and how it constitutes the first step to a relativistic model of economics. In fact, we believe that intrinsic time is the starting point to a whole new theory of economics, and more.
In the next report, I will talk about Benoit Mandelbrot, power laws and fractals, and I will explain the larger context of intrinsic time and how it ushers in a new economic theory.
Richard Olsen is CEO & Founder of Lykke Corp